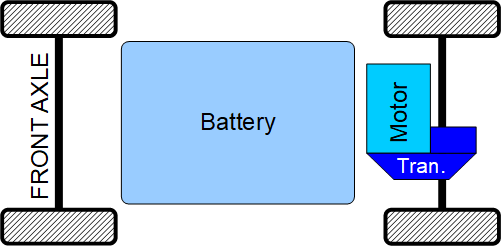
Applicable vehicle architectures ⓘ
This simulator is only applicable to single motor, single-step transmission electric vehicles, with either front or rear-wheel drive.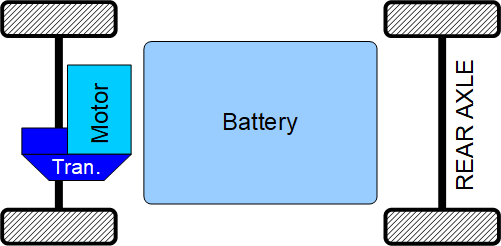
User input data ⓘ
In this section the user sets the input data required for component sizing and simulation. If unsure of some parameters, change only the one highlighted in orange. Click on the icons to open the dialog box. km : vehicle range
kph : top speed on flat road
kph : top speed on road with slope
kph : top speed on hill climb
% : road slope for simulation
% : road slope for high speed
% : hill climb slope
s : acceleration time 0-100 kph
m : curb height
- : aerodynamic drag coefficient
m2 : maximum frontal area
kg : vehicle mass
kg : maximum payload
- : rolling resistance coefficient
m - tire rolling radius
% : driveline efficiency
- : transmission gear ratio
- : tire friction coefficient
% : axle load ratio during acceleration
V : battery pack nominal voltage
V : battery cell nominal voltage
Ah : battery cell rated capacity
h-1 : battery cell C-rate
kg : battery cell mass
W : auxiliary systems power
- : additional battery strings
% : minimum battery SoC
% : maximum battery SoC
Ω : battery internal resistance
Default data: Tesla Model 3 RWD Standard Range
Source: Wikipedia
Wheel Power and Torque ⓘ
Based on the input data, the minimum required wheel power and torque are calculated, for different driving scenarios. These values are later used to define the electric motor torque and power output.Electric Motor (minimum required performance) ⓘ
The minimum continuous power and peak torque are calculated based on the wheel torque and power, taking into account the transmission gear ratio and the driveline efficiency.Motor continuous power [kW]
( %)
Motor peak torque [Nm]
( %)
Motor maximum speed [rpm]
( %)
Electric Motor acceleration performance ⓘ
Based on the 0 - 100 kph acceleration time, vehicle mass, wheel radius and transmission ratio, the peak torque and base speed are calculated. The assumption is that 100 kph is obtained at base speed.Motor peak torque (acceleration) [Nm]
( %)
Motor base speed [rpm]
( %)
Electric Motor parameters definition ⓘ
The motor output curves (torque and power) are generated from the user's input data. The peak torque and continuous power values must be equal or higher than the values calculated for minimum performance. Nm : maximum torque (peak)
% : maximum torque (cont.)
s : peak torque maximum time
rpm : base motor speed
rpm : maximum motor speed
% : motor & inverter max. efficiency
% : motor & inverter min. efficiency
- : copper losses coefficient
- : iron losses coefficient
- : windage losses coefficient
W : constant power losses
Driving Cycle ⓘ
The vehicle range simulation is done for the selected driving cycle. By selecting the driving cycle and pressing the RUN button, a new simulation is generated. The last value of the energy traces represents the energy consumed on the selected cycle.Select cycle to run:
Enter time and speed point separated by commas
s : time
kph : speed
Select cycle data output:
Cycle statistical data
| Data \ Cycle | WLTC | FTP | HWFET | US06 | CUSTOM |
| Duration [s] | 1800 | 1874 | 765 | 596 | |
| Length [km] | 23.266 | 17.767 | 16.512 | 12.891 | |
| Average non-zero speed [kph] | 53.49 | 42.25 | 78.16 | 83.88 | |
| Total time @ 0 kph | 226 | 338 | 4 | 42 | |
| Average acceleration [m/s2] | 0.41 | 0.66 | 0.36 | 0.89 | |
| Average deceleration [m/s2] | -0.45 | -0.76 | -0.44 | -0.90 |
Battery ⓘ
The battery parameters are calculated for each driving cycle. At each press of the RUN button, by default, the battery parameters are recalculated based in the input data. To freeze the battery parameters between simulations, select the "Hold" radio button.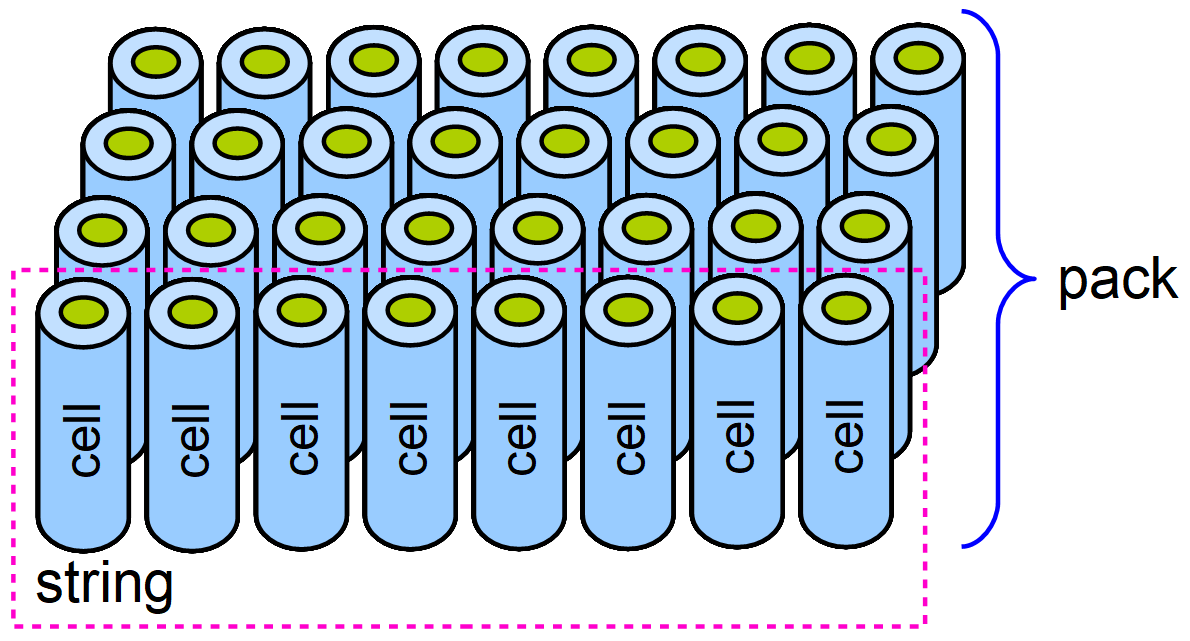
| Parameter \ Cycle | WLTC | FTP | HWFET | US06 | CUSTOM |
| Specific energy consumption [Wh/km] |
( %)
|
( %)
|
( %)
|
( %)
|
( %)
|
| Number of cells in string [-] |
( %)
|
( %)
|
( %)
|
( %)
|
( %)
|
| Battery cell energy [Wh] |
( %)
|
( %)
|
( %)
|
( %)
|
( %)
|
| String energy [Wh] |
( %)
|
( %)
|
( %)
|
( %)
|
( %)
|
| Battery pack energy [kWh] (based on range and energy consumption) |
( %)
|
( %)
|
( %)
|
( %)
|
( %)
|
| Number of strings in parallel [-] |
( %)
|
( %)
|
( %)
|
( %)
|
( %)
|
| Total number of cells in the battery pack [-] |
( %)
|
( %)
|
( %)
|
( %)
|
( %)
|
| Maximum discharge current per string [A] |
( %)
|
( %)
|
( %)
|
( %)
|
( %)
|
| Maximum discharge current battery pack [A] |
( %)
|
( %)
|
( %)
|
( %)
|
( %)
|
| Battery pack maximum power [kW] |
( %)
|
( %)
|
( %)
|
( %)
|
( %)
|
| Battery pack total capacity [Ah] |
( %)
|
( %)
|
( %)
|
( %)
|
( %)
|
| Battery pack total energy [kWh] |
( %)
|
( %)
|
( %)
|
( %)
|
( %)
|
| Battery pack mass (cells only) [kg] |
( %)
|
( %)
|
( %)
|
( %)
|
( %)
|
Main battery parameters ()
Energy [kWh]
( %)
Capacity [Ah]
( %)
Maximum power [kW]
( %)
Maximum current [A]
( %)
Simulation setup ⓘ
The numerical solver type and simulation time step decide the accuracy of the simulation. For better accuracy choose Runge-Kutta method and smaller time step. However, on low-end mobile devices it's better to use Euler and highest integration step, in order to limit the CPU load. The performance duration time is only used for performance simulation. The drive cycle simulation runs for the entire duration of th predefined cycles.Speed controller (PID) ⓘ
The speed controller replaces the driver and its purpose is to keep the vehicle following the speed profile of the selected cycle, by regulating the motor torque. The default setting is for a smooth driver, with some delay relative to the cycle speed profile. For a more aggressive driver set the Kp and Ki terms to 100 and 0.2 respectively.
Left axis:
Right axis:
Nm/kph : proportional gain
Nm/kph : integral gain
Nm/kph : derivative gain
Simulation results ⓘ
The final simulation results are displayed in this section. The vehicle's performance is compared with the initial input data. If there are mismatches, the user can follow the advice given to improve the vehicle's performance.
Left axis:
Right axis:
ATTENTION! All parameters are calculated based on simplified equations and the results might be different from real vehicle! Use at your own risk!
PERFORMANCE: Simulation vs. Target
| Parameter | Simulation | Target | Comparison against target |
How to improve |
| Top speed [kph] (PERFORMANCE) |
( %)
|
- | - |
To increase top speed: - increase motor continuous power - improve vehicle aerodynamics (reduce air drag or frontal area) |
| Time 0-100 kph [s] (PERFORMANCE) |
( %)
|
- | - |
To improve (reduce) acceleration time: - increase motor torque - increase transmission gear ratio - reduce vehicle mass |
| Vehicle range [km] () |
( %)
|
- | - |
To increase range: - increase battery energy - reduce vehicle mass - improve aerodynamics - improve driveline and motor efficiency |
ALERTS: Maximum thresholds exceeded
| Parameter | Simulation | Limit | Comparison against limit |
How to improve |
| Max. battery current [A] (PERFORMANCE) |
( %)
|
- | - |
To increase the battery's maximum current limit: - use higher C-rate battery cells - increase the number of strings To decrease the battery current: - increase battery voltage - reduce motor peak torque |
| Max. battery power [kW] (PERFORMANCE) |
( %)
|
- | - |
To increase the battery's maximum power limit: - use higher C-rate battery cells - increase the number of strings To decrease the battery power: - reduce motor peak power |
| Max. motor speed [rpm] (PERFORMANCE) |
( %)
|
- | - |
To increase the motor's maximum speed limit: - increase the speed range of the motor To decrease the motor speed: - reduce the transmission gear ratio |
| Max. wheel force [N] (PERFORMANCE) |
( %)
|
- | - |
To increase the wheel's maximum force limit: - increase wheel friction coefficient - increase vehicle mass To decrease the wheel force: - reduce the peak motor torque - reduce the transmission gear ratio |
Simulation run...